
UNIT 1: PHYSICAL GEOGRAPHY
Basics: Geographic Tech (2/2)
The digital mapping revolution caused an explosion of map creation in the 1990s. In 1996, MapQuest, the first popular online mapping service, allowed anyone with internet access the ability to create customized maps of almost any location in the United States. Within a few months, millions of people had become “cartographers”. They were soon producing more unique maps in a single day than had been created during the entire history of paper cartography!
GPS
For thousands of years, we have used the position of the stars to
navigate. Now, using artificial "stars" (satellites), we can navigate
using computers and the Global Positioning System. The GPS system is based on a network of satellites that send out
signals along the radio frequency. This system provides accurate
positions no matter the weather, time of day or location. As long as a
GPS unit can get a proper signal, the position can be determined. These satellites orbit the earth twice a day at very high altitude. A
user with a GPS receiver needs at least four satellites above the
horizon in order to able to computer his position. Each of these
satellites will tell the receiver how far the satellite is away and the
satellite's exact position in space. The GPS receiver now does some
fancy math to figure out absolute position, usually in latitude and
longitude. GPS receivers can theoretically be accurate down to centimeters, but usually they are not this accurate due to various errors.
Once just used for science, GPS units have become affordable enough
that they are used by emergency services, utilities and your average car
driver. Geographers use GPS to accurately record the position of an
area of interest and in remote sensing.
GIS
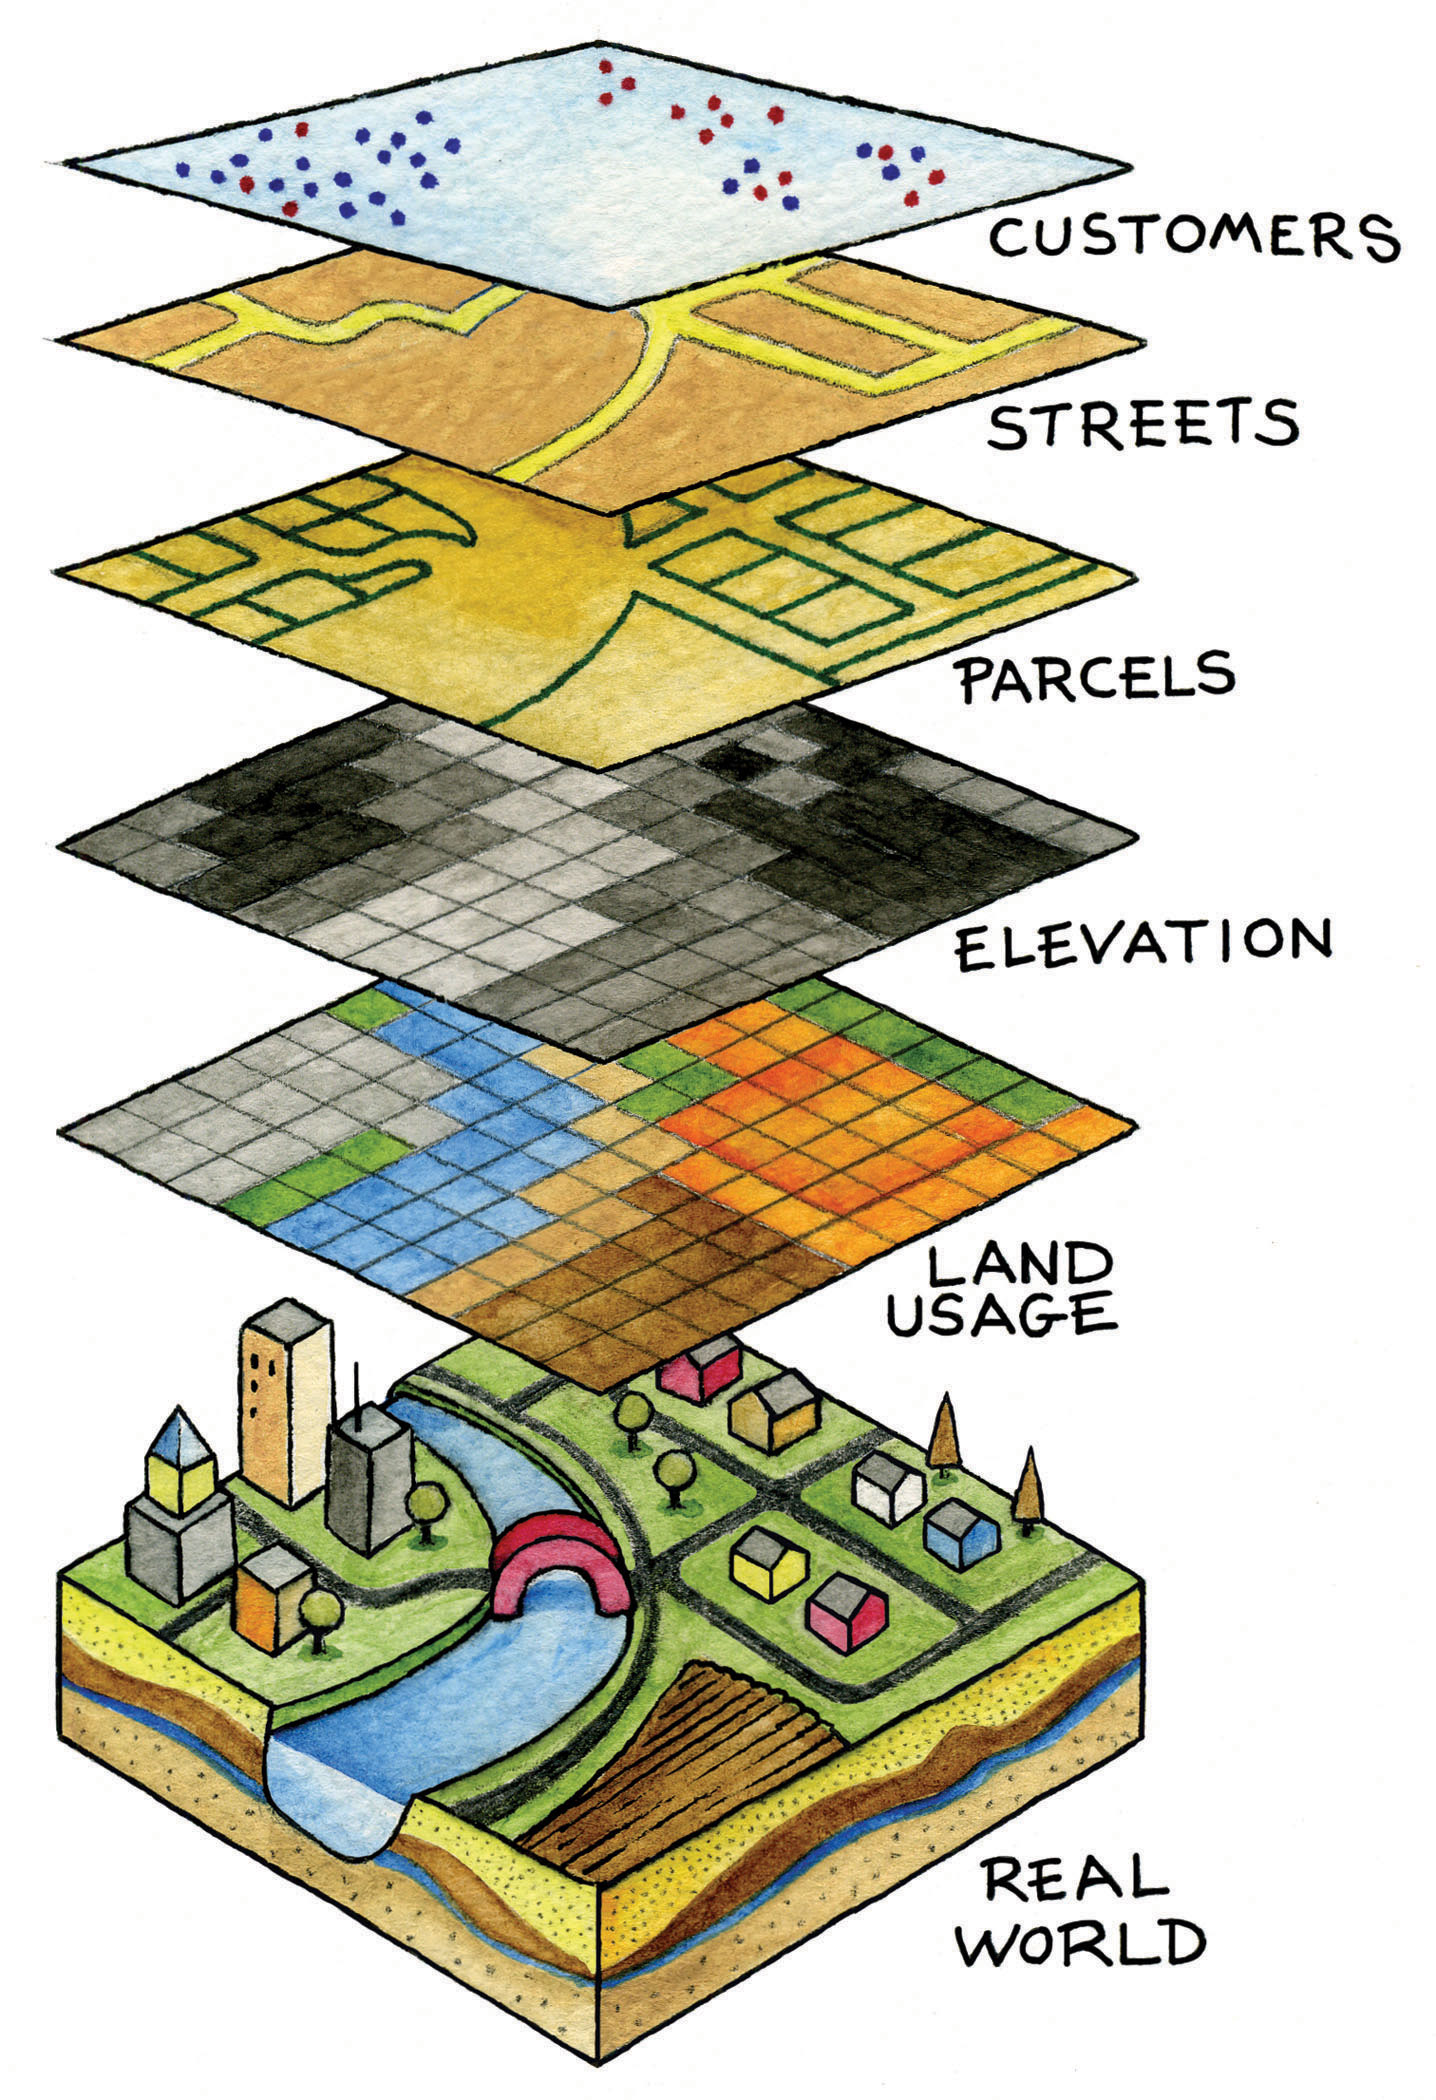
A geographic information system (GIS) is a computer system for
capturing, storing, checking, and displaying data related to positions
on Earth’s surface. By relating seemingly unrelated data, GIS can help
individuals and organizations better understand spatial patterns and
relationships.
GIS technology is a crucial part of spatial data
infrastructure, which may be defined as “the technology, policies,
standards, human resources, and related activities necessary to acquire,
process, distribute, use, maintain, and preserve spatial data.”
GIS can use any information that includes location. The location can be
expressed in many different ways, such as latitude and longitude,
address, or postal code.
Many different types of information
can be compared and contrasted using GIS. The system can include data
about people, such as population, income, or education level. It can
include information about the landscape, such as the location of
streams, different kinds of vegetation, and different kinds of soil. It
can include information about the sites of factories, farms, and
schools; or storm drains, roads, and electric power lines.
With
GIS technology, people can compare the locations of different things in
order to discover how they relate to each other. For example, using GIS,
a single map could include sites that produce pollution, such as
factories, and sites that are sensitive to pollution, such as wetlands
and rivers. Such a map would help people determine where water supplies
are most at risk.
Data Capture
Putting information into GIS is
called data capture. Data that are already in digital form, such as
most tables and images taken by satellites, can simply be uploaded into
GIS. Maps, however, must first be scanned, or converted to digital
format.
GIS applications include both hardware and
software systems. These applications may include cartographic data,
photographic data, digital data, or data in spreadsheets. Cartographic
data are already in map form, and may include such information as the
location of rivers, roads, hills, and valleys. Cartographic data may
also include survey data, mapping information which can be directly
entered into a GIS. Additionally, photographic interpretation is a major part
of GIS. Photo interpretation involves analyzing aerial photographs and
assessing the features that appear. Digital data can also be
entered into GIS. An example of this kind of information is computer
data collected by satellites that show land use—the location of farms,
towns, and forests.
Finally,
GIS can also include data in table or spreadsheet form, such as
population demographics. Demographics can range from age, income, and
ethnicity to recent purchases and Internet browsing preferences. GIS
technology allows all these different types of information, no matter
their source or original format, to be overlaid on top of one another on
a single map. GIS uses location as the key index variable to relate
these seemingly unrelated data.
Spatial Relationships
GIS technology can
be used to display spatial relationships and linear networks. Spatial
relationships may display topography, such as agricultural fields and
streams. They may also display land-use patterns, such as the location
of parks and housing complexes.
Linear networks, sometimes
called geometric networks, are often represented by roads, rivers, and
public utility grids in a GIS. A line on a map may indicate a road or
highway. With GIS layers, however, that road may indicate the boundary
of a school district, public park, or other demographic or land-use
area. Using diverse data capture, the linear network of a river may be
mapped on a GIS to indicate the stream flow of different tributaries. GIS
must make the information from all the various maps and sources align,
so they fit together on the same scale. A scale is the relationship
between the distance on a map and the actual distance on Earth.
Often,
GIS must manipulate data because different maps have different
projections. A projection is the method of transferring information from
Earth’s curved surface to a flat piece of paper or computer screen.
Different types of projections accomplish this task in different ways,
but all result in some distortion. To transfer a curved,
three-dimensional shape onto a flat surface inevitably requires
stretching some parts and squeezing others. A world map can
show either the correct sizes of countries or their correct shapes, but
it can’t do both. GIS takes data from maps that were made using
different projections and combines them so all the information can be
displayed using one common projection.
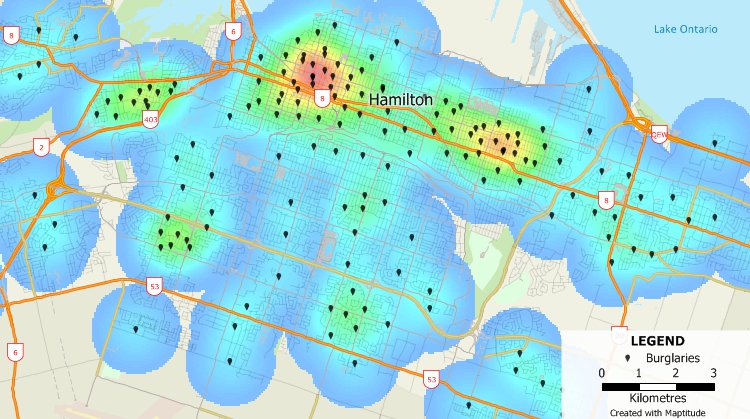
Once all of the desired data have been entered into a GIS system, they can be combined to produce a wide variety of individual maps, depending on which data layers are included. One of the most common uses of GIS technology involves comparing natural features with human activity. Below is a GIS map of Hamilton, Ontario that has been used to visualize crime hot-spots such as burglaries.
GIS maps can display what manmade features are near
certain natural features, such as which homes and businesses are in
areas prone to flooding. It also allows to “dig
deep” in a specific area with many kinds of information. Maps of a
single city or neighborhood can relate such information as average
income, book sales, or voting patterns. Any GIS data layer can be added
or subtracted to the same map. As well, GIS maps can be used to show
information about numbers and density. For example, GIS can show how
many doctors there are in a neighborhood compared with the area’s
population. With GIS technology, researchers can also look at
change over time. They can use satellite data to study topics such as
the advance and retreat of ice cover in polar regions, and how that
coverage has changed through time. A police precinct might study changes
in crime data to help determine where to assign officers.
One
important use of time-based GIS technology involves creating time-lapse
photography that shows processes occurring over large areas and long
periods of time. For example, data showing the movement of fluid in
ocean or air currents help scientists better understand how moisture and
heat energy move around the globe. GIS technology sometimes
allows users to access further information about specific areas on a
map. A person can point to a spot on a digital map to find other
information stored in the GIS about that location. For example, a user
might click on a school to find how many students are enrolled, how many
students there are per teacher, or what sports facilities the school
has. GIS systems are often used to produce three-dimensional
images. This is useful, for example, to geologists studying earthquake
faults.
GIS technology makes updating maps much easier than
updating maps created manually. Updated data can simply be added to the
existing GIS program. A new map can then be printed or displayed on
screen. This skips the traditional process of drawing a map, which can
be time-consuming and expensive.