UNIT 1: PHYSICAL GEOGRAPHY
Basics: Types of Maps
Millions of unique maps are in use throughout the world. Most of these maps can be placed into one of two groups: 1) reference maps; and, 2) thematic maps.
- Reference maps show the location of geographic boundaries, physical features of Earth, or cultural features such as places, cities, and roads. Political maps, physical maps, road maps, topographic maps, time zone maps, geologic maps, and zip code maps are all examples of reference maps. A variety of reference maps have been created for almost every country of the world.
- Thematic maps show the variation of a topic (the theme) across a geographic area. Weather maps showing daily high temperatures across Alberta are familiar examples of a thematic map. They are made by starting with a reference map of the Alberta. Then temperature data is plotted atop of the reference map using colors to communicate the temperature forecast. Income maps and resource maps are other types of thematic maps.
People have been making maps for thousands of years. The first map might have been a sketch made in sand using a stick or a finger. It might have been charcoal marks on a stone, or engravings on a clay tablet. Eventually maps were drawn on paper. The printing press enabled those maps to be printed on paper and distributed by the thousands.
Papermaking and printing eventually became inexpensive enough that almost anyone could afford to purchase a map, and until the late 1960s, many gasoline stations were still distributing free road maps as an advertising courtesy to their customers.
In the 1990s the internet enabled the distribution of maps online, and the economics of map distribution (and the ability to sell certain types of maps) were changed forever. Soon, with interactive map serving, any user of the internet could become a cartographer. Now more unique maps are produced online every day than were made in across the entire history of mapmaking, from pre-history until about 1992.
Some Basic Examples:
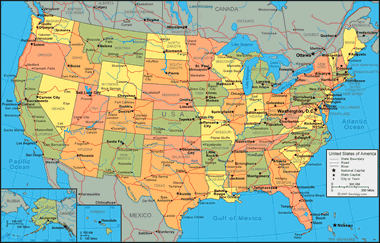 Political Maps are among the most widely used reference maps. They
are mounted on the walls of classrooms throughout the world. They show
the geographic boundaries between governmental units such as countries,
states, and counties. They show roads, cities and major water features
such as oceans, rivers and lakes.
Political Maps are among the most widely used reference maps. They
are mounted on the walls of classrooms throughout the world. They show
the geographic boundaries between governmental units such as countries,
states, and counties. They show roads, cities and major water features
such as oceans, rivers and lakes.
Political maps help people understand the geography of the world. They are usually the first type of map that students are introduced to in school. They are also known as “reference maps” because people refer to them again and again as they have questions.
Thousands of different political reference maps have been prepared to show the current geography of the United States. There are maps of the entire nation, maps for each of the 50 states, maps of the 3142 counties (parishes in Louisiana, and boroughs in Alaska) that make up the states. Most counties, boroughs and parishes are further subdivided into even smaller political units. An incredible number of political maps have been prepared just to display the geography of the United States.
The maps most commonly seen in classrooms and offices are political maps of the world, countries and continents. They are often annotated with push pins, sticky notes, photographs, marker flags and string to show the travels of a family, locations of a business, or other locations and activities worthy of display.
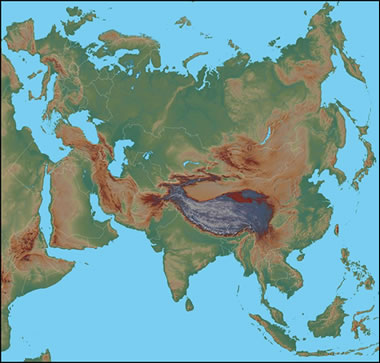 Physical maps are designed to show the natural landscape features of
Earth. They are best known for showing topography, either by colors or
as shaded relief. Physical maps often have a green to brown to gray
color scheme for showing the elevation of the land. Darker greens are
used for near-sea-level elevations, with the color grading into tans and
browns as elevations increase. The color gradient often terminates in
shades of gray for the highest elevations.
Physical maps are designed to show the natural landscape features of
Earth. They are best known for showing topography, either by colors or
as shaded relief. Physical maps often have a green to brown to gray
color scheme for showing the elevation of the land. Darker greens are
used for near-sea-level elevations, with the color grading into tans and
browns as elevations increase. The color gradient often terminates in
shades of gray for the highest elevations.
Rivers, lakes, seas and oceans are usually shown in blue, often with a light blue color for the most shallow areas and darkening in a gradient or by intervals for areas of deeper water. Glaciers and ice caps are shown in white colors.
Physical maps usually show the most important political boundaries, such as state and country boundaries. Major cities and major roads are often shown. This cultural information is not the focus of a physical map, but it is often included for geographic reference and to increase the utility of the map for many users.
This physical map of Eurasia shows the topography of the land in a color-gradient relief. Dark greens are used for near-sea-level elevations, and the green grades to tan and brown as elevation increases. The highest elevations are shown in shades of gray. If you are familiar with the physical features of Eurasia, you can probably recognize the Himalaya Mountain Range, the Tibetan Plateau, the Alps, and the more subtle Ural Mountains. Lake Baikal, the world's largest freshwater lake by volume, can be seen in central Asia.
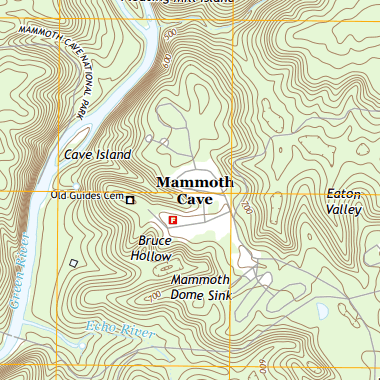 Topographic maps are reference maps that show the shape of Earth’s
surface. They usually do this with lines of equal elevation known as
“contour lines”, but elevation can also be shown using colors (second map), color gradients, shaded relief and a number of other methods.
Topographic maps are reference maps that show the shape of Earth’s
surface. They usually do this with lines of equal elevation known as
“contour lines”, but elevation can also be shown using colors (second map), color gradients, shaded relief and a number of other methods.
Topographic maps are frequently used by hunters, hikers, skiers, and others seeking outdoor recreation. They are also essential tools of the trade for geologists, surveyors, engineers, construction workers, landscape planners, architects, biologists and many other professions - especially people in the military.
Topographic maps also show other important natural features such as lakes, rivers and streams. Their locations are determined by topography, making them important natural elements of topographic maps.The map to the right featuring Mammoth Cave National Park in Kentucky shows Earth's topography using brown contour lines with a contour interval of 20 feet. Roads, place names, streams and other features are also shown. Areas on the map where the brown contour lines are close together have steep slopes. Areas where the contour lines are spaced far apart have gentler slopes.
Important cultural features are also shown on topographic maps. These include roads, trails, buildings, place names, bench marks, cemeteries, churches, schools and much more. A standardized set of special symbols has been developed for this use.
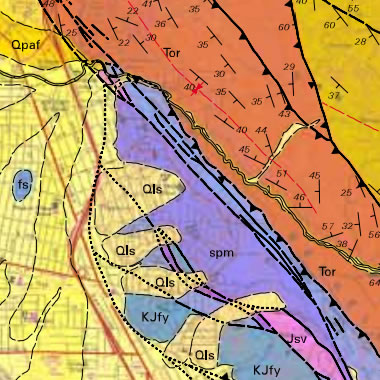 Geologic maps show the types of rocks
and sediments present immediately below the surface of a geographic
area. Sediment cover is shown in shades of yellow, and rock units are
shown in a variety of colors, often based upon their lithology. Rock
unit contacts, faults, folds, and strike and dip measurements are
plotted in black.
Geologic maps show the types of rocks
and sediments present immediately below the surface of a geographic
area. Sediment cover is shown in shades of yellow, and rock units are
shown in a variety of colors, often based upon their lithology. Rock
unit contacts, faults, folds, and strike and dip measurements are
plotted in black.
Geologic maps are important data sources for many types of work. Certain types of rock are used for construction materials, and a geologic map shows where they are located at the surface. Other types of rock might contain valuable minerals, and a geologic map can be used as a preliminary tool for deciding where to drill or prospect.
Areas near volcanoes might be underlain by lava flows, lahar deposits, pyroclastic flows or other volcanic products. Geologic maps can be used to conduct a preliminary volcanic hazard assessment of an area. Most geologic maps are usually accompanied by at least one cross-section that illustrates what is expected to be seen if a “slice through the Earth” was cut across the map area. These cross-sections illustrate the geologic structures inferred by mapping the rocks and sediments above.
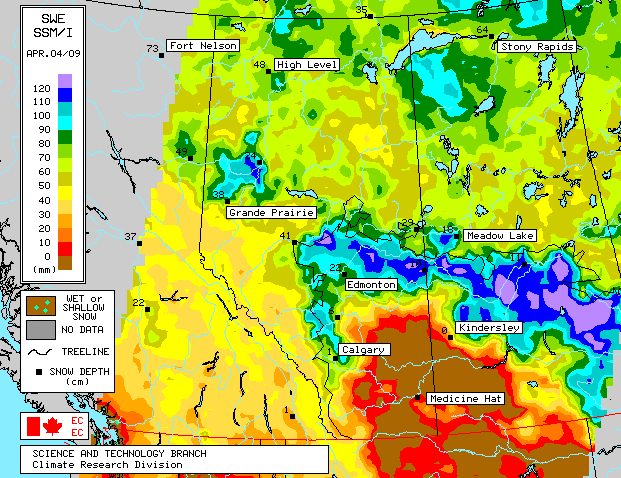
People use an incredible number of weather maps. They are used to show predicted temperatures, predicted precipitation, storm warnings of various kinds, wind speed and direction, chance of precipitation, type of precipitation, snow accumulation, frost prediction and many other aspects of weather.
All of these weather maps are continuously updated to communicate the most current information. They are the world's most frequently consulted thematic maps. Weather maps are presented in newspapers, television programs and especially on websites. Delivering weather maps on websites and through web apps gives people around the world instant access to weather information.
Many weather maps are animated maps that show historical or projected changes in the weather. These are extremely useful for people who need to know how changes in weather will impact their travel, workday, recreation, and many other plans.
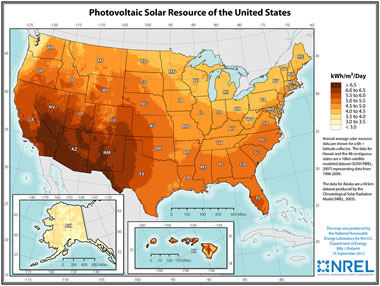 Resource maps are incredibly important to a lot of different fields of study. Resource maps are a type of thematic map where the aim is to communicate the geographic distribution of natural resources. These maps might show countries with the highest diamond production or the geographic extent of an oil or gas field. The map shown here illustrates the geographic pattern of solar generating capacity for the United States.
Resource maps are important because they help governments understand their natural resource assets and the natural resource assets of their allies and potential enemies. Resource maps help mining companies target their exploration efforts. They are also important for assessing the transportation opportunities and problems associated with the distribution of resources and the location of where they are consumed.